R/geom_stat_areas.R
geom_stat_areas.Rd
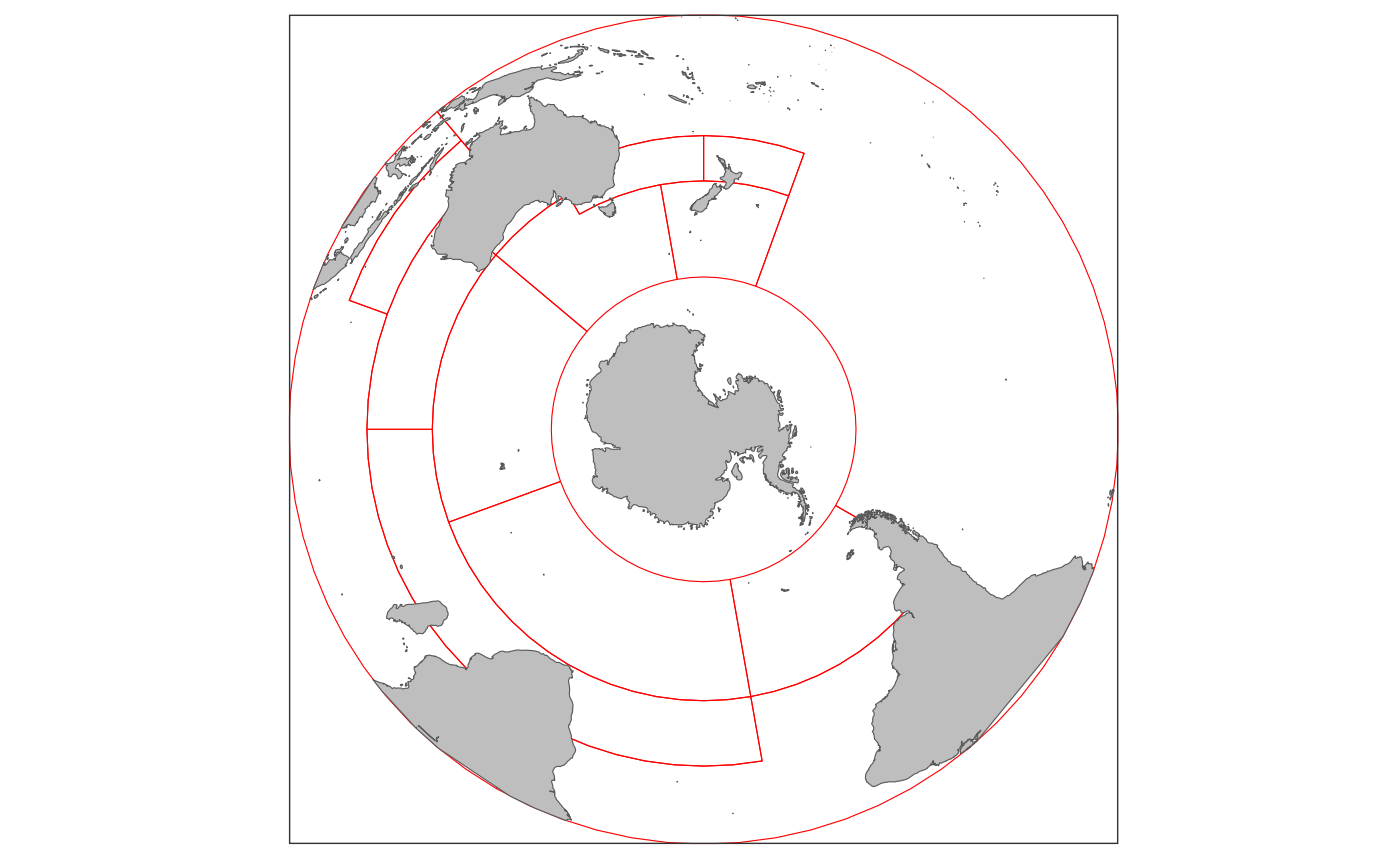
Return ggplot object for CCSBT statistical areas in the southern hemisphere.
ggplot
geom_stat_areas(...)
arguments to be passed to geom_sf.
geom_sf
library(ggplot2)
library(sf)
library(sefraInputs)
ggplot() + geom_stat_areas(col = "red") + theme_sh()